
Introducing The Market Analytics Dashboard
Have you ever wondered where else your customers shop? Or, how far they travel to get to your store? These questions – and so many more – can now be answered.
Introducing: The Market Analytics Dashboard – an easy-to-navigate and comprehensive view of PlaceIQ’s premier LandMark location dataset. For the first time ever, this hands-on dashboard empowers marketers and brand analysts to access and understand location-based trends related to market opportunities, competition, and shopper behaviors. This dashboard comes at the heels of the Traffic Analytics dashboard release, which reveals trends related to traffic in stores both nationally and by DMA.
With the Market Analytics Dashboard, Marketers Can Easily Answer Questions Like:
- Where are my biggest opportunities and am I missing any potential new markets?
- How can we strategically conquest customers by DMA?
- How can I capture more visitors at a specific time?
- Are my competitors who I think they are — where else do my customers shop?
The Market Analytics Dashboard is powered through PlaceIQ’s LandMark data – a premier location dataset that enables groundbreaking insights and analytics for marketers. The LandMark dataset leverages a combination of foreground and background movement data from over 165M devices to deliver scalable, accurate solutions – including the Market Analytics Dashboard.
Product Information
PlaceIQ Movement
Develop smarter marketing strategies and drive real-world consumer actions by using PlaceIQ’s proprietary visitation data to analyze consumer movement, on your own terms.
So, how would a brand leverage this new dashboard?
Let’s take a look at how a popular QSR brand – McDonald’s – could use this cutting-edge dashboard to answer the question,
“How can we best capture new lunch diners through an advertising campaign?”
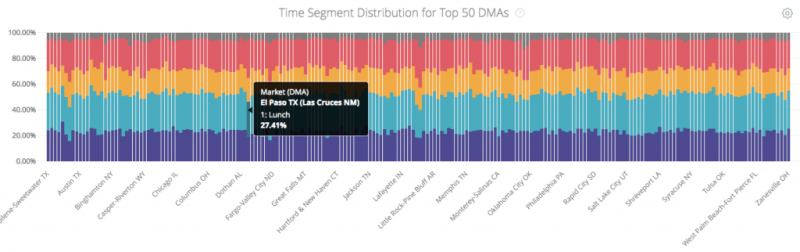
The first step would be to understand which markets have a lower lunchtime distribution. In other words – where are you underperforming during lunch hours? By taking a look at the National Time Segment Distribution chart within the dashboard, it’s easy to spot that El Paso, Texas has a smaller distribution during lunch hours that other markets. There might be an opportunity for McDonald’s to reach new customers here.
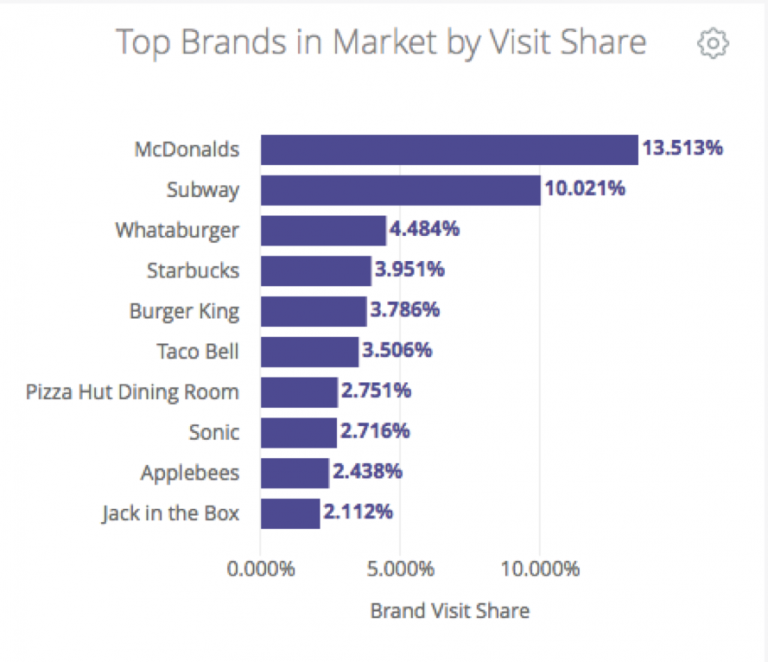
To determine whether or not this would be a worthwhile city to invest marketing dollars, let’s take a look at the competitive market at the DMA level. When viewing the Top Brands in Market by Visit Share for El Paso, TX, you can see there are a couple of competitors who are close in visit share to McDonald’s – including Subway, Whataburger and Burger King. However, McDonald’s still emerges as the overall ‘winner.’ But before we throw in the towel, let’s take a closer look at the competitive market during lunch hours.
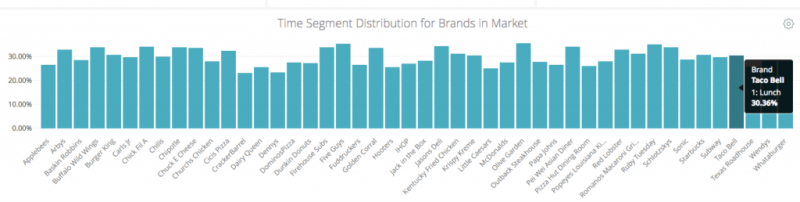
Interestingly, a few of the ‘Top Brands by Visit Share’ see a higher lunchtime distribution than McDonald’s – including Whataburger and Taco Bell. This means that a higher percentage of their visitors come during lunchtime when compared to McDonald’s distribution. When reading these two charts together, it’s clear that these brands are not only among the top 10 QSRs visited — a high portion of their visitors come during lunch hours.
In order to successfully reach new lunch visitors in El Paso, Texas, McDonald’s might consider a location-based conquesting campaign to reach frequent lunchtime visitors of these ‘winning’ QSR establishments with a special promotional message.
This is just one example of how PlaceIQ’s Market Analytics Dashboard can help brands answer important questions, and shape their marketing and business strategies with location intelligence.
Develop smarter marketing strategies and drive real-world consumer actions by using and proprietary visitation data to analyze consumer movement, on your own terms. Read more about our product PlaceIQ Movement.


Build the Context You Need Around Your Data
Chances are, we’ve all heard the story of the lighthouse and the naval vessel, in which the captain of a large ship sees a light in the distance and transmits a command that the smaller vessel...

New Year’s Resolutions and Gym Deals: A Catalyst for Changing Consumer Behavior
Consumers kick-started the year by building more health-focused habits, with nearly a 5% increase in visits to gyms and grocery stores, while interest in less healthy options like convenience stores...

B2B Data Enrichment for Beginners
Your competitors use data to target your customers, discover unmet needs, and explore new markets. If you’re not using data to your advantage, you risk falling behind the rest of the pack. In a...