
Identifying Location Outliers Using Isolation Forest in Scala Spark
I’m often brought the challenge of how to optimize our data to address real world problems for our clients. In this blog post, I describe my approach to a data science problem at PlaceIQ in which I attempted to identify outliers in our observed locations using an anomaly detection method called Isolation Forest.
Background:
PlaceIQ creates and maintains a proprietary map that represents commercial and residential locations across the United States. Think: show me all the Panera’s in the U.S.. This map, which we call basemap, consists of polygons hand-drawn by cartographers or sourced from third parties. Having polygons that accurately represent a chain’s physical store footprint is important for extracting accurate visitation signals.
However, one can imagine scenarios in which the polygons that outline the perimeter of a store’s location, or the actual real locations are not suitable for analytics purposes. For example, it would be problematic to extract accurate visitor counts to a McDonald’s if it were:
- Located at the base of a skyscraper in Manhattan
- Located inside of a Walmart
- Located at a strip mall where there is currently only a third-party polygon outlining the entire strip mall
- Geocoded incorrectly to a location that is nota McDonald’s
- Permanently closed, but not updated in the basemap yet
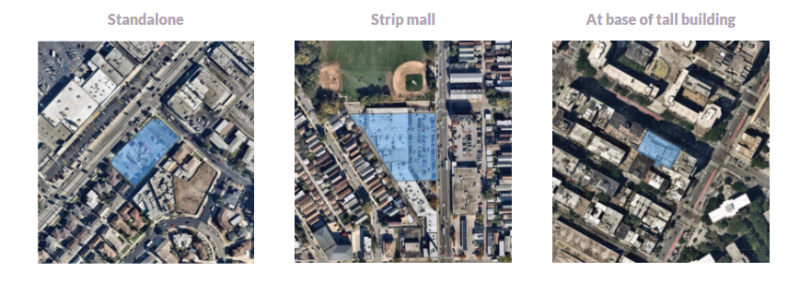
Figure 1. Examples of McDonald’s locations. The standalone location would be considered analytics-grade for measuring foot traffic to McDonald’s. The other two polygons (middle and right) would not be recommended for analytics.
We would like to identify the small fraction of polygons in our basemap that do not accurately generate visits. Once the problematic locations are found, they can be flagged or manually corrected. We could also create better rules to identify and filter them more specifically.
Data science problem:
Given PlaceIQ’s large collection of 15 million commercial polygons, how do we algorithmically identify problematic locations? One approach is to take advantage of the fact that for any chain, the relatively few locations that are problematic often appear very different and produce visitation patterns that are very different from other locations of the same chain. In other words, we can treat this as an outlier detection problem. This problem then breaks down into:
- Identifying and creating relevant location features
- Generating an outlier score for each location based on the features using an outlier detection method (Isolation Forest in this case)
- Validating outlier detection method
1. Identifying and creating relevant location features
First, we use our domain knowledge to create features that we think might be relevant for finding outliers. We chose:
- Area of polygon
- Number of business listings inside the polygon
- Mean daily visitors at location
- Correlation between location’s day-of-week visitation patterns to the chain’s average pattern
- Correlation between location’s hour-of-day visitation patterns to the chain’s average pattern
The first three are easy to understand. For example, if a polygon describing a McDonald’s is the size of a football stadium, has many business listings inside it, and has abnormally high foot traffic, something might be amiss. The last two correlation metrics represent how much a chain location’s visitation patterns deviates from the typical pattern for that chain. For example, Chick-Fil-A, which we know is closed on Sundays, on average shows a decent amount of foot traffic from Monday to Saturday, and very minimal activity on Sundays. We can correlate every individual Chick-Fil-A location’s day-of-week pattern to the Chick-Fil-A brand average pattern. A correct Chick-Fil-A location would have a high correlation score, whereas an incorrect Chick-Fil-A location (say the polygon actually outlines a mall encompassing a Chick-Fil-A) would have a low correlation score.
Note that before feeding correlation into Isolation Forest, we cap correlations that are greater than 0.8 at 0.8. The reason is because we only want to identify locations that have very low correlation; locations with unusually high correlation are not actually outliers in terms of their correlation to the brand average.
Each of these five features are useful on their own. We have previously examined outliers in each individual feature to identify common types of problematic locations; we then created rules to identify and flag/filter these location types in basemap. Here, we want to generate a single score to each location that encapsulates its outlierness across these five dimensions. For this, we turn to Isolation Forest.
Product Information
PlaceIQ Movement
Develop smarter marketing strategies and drive real-world consumer actions by using PlaceIQ’s proprietary visitation data to analyze consumer movement, on your own terms.
2. Generating an outlier score for each location using Isolation Forest
Isolation Forest is a tree-based anomaly detection method where each tree recursively partitions data at a random value along a random axis, until data points are isolated. In a tree representation, once partitioning is done, the outlier points tend to have shorter path lengths from the root node, while non-outlier points tend to have longer path lengths from the root node. Therefore, a forest of random trees collectively produce shorter paths for points that are likely to be outliers. Path lengths are normalized to an outlier score between 0 and 1.
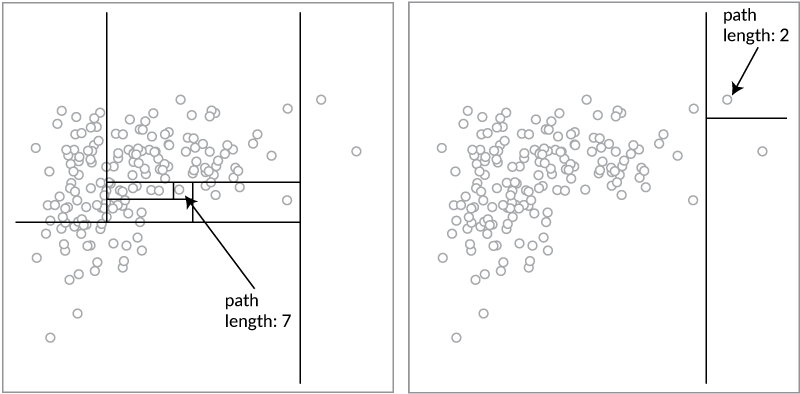
Figure 2. Illustration of a non-outlier (left) and outlier data point (right). Each panel shows only the splits that isolate the data point.
Isolation Forest has some advantages that are relevant to us:
- Unsupervised algorithm: does not need labelled data
- Does not require data to be normally distributed
- Works with higher dimensional data
Using Isolation Forest in Scala Spark is pretty straightforward:
import com.linkedin.relevance.isolationforest._
import org.apache.spark.ml.feature.VectorAssembler

val locations = spark.read.parquet("INPUT_PATH")

val assembler = new VectorAssembler().setInputCols(Array("area", "num_chains", "mean_daily_visits", "day_of_week_corr", "hour_of_day_corr")
).setOutputCol("features")

val features_df = assembler.transform(locations)

val isolation_forest = new IsolationForest()
  .setNumEstimators(100)
  .setBootstrap(false)
  .setMaxSamples(256)
  .setMaxFeatures(5)
  .setFeaturesCol("features")
  .setPredictionCol("predicted_label")
  .setScoreCol("outlier_score")
  .setContamination(0.1)
  .setRandomSeed(1)

val model = isolation_forest.fit(features_df)

val features_scores_df = model.transform(features_df)
3. Validation
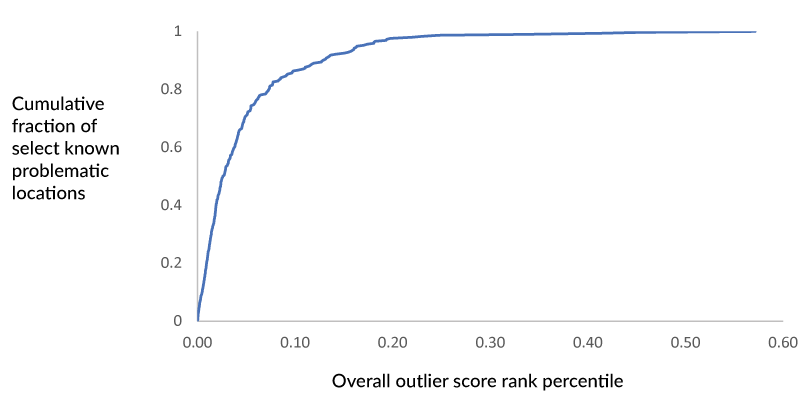
To empirically validate the outlier scores, we can ask whether some known types of problematic locations receive high outlier scores (if we had a full labelled dataset, we could calculate metrics like AUC). For example, we can ask if McDonald’s that exist inside other structures (e.g. Walmart) and closed McDonald’s locations receive high outlier scores. As shown below, 86% of known problematic locations are in the top 10% of outlier scores. Thus, we can calculate outlier scores across PlaceIQ chain locations which allows us to prioritize locations that we send to our cartographers for manual review, flagging and/or correction – optimizing and prioritizing our data cleansing efforts.
Final thoughts
Here, I’ve described one approach to identifying problematic locations using outlier detection that can be applied relatively quickly. Another approach would be to generate labelled datasets and to train a supervised learning model to classify locations as being analytics-grade or not; this is something we are beginning to explore.
Develop smarter marketing strategies and drive real-world consumer actions by using and proprietary visitation data to analyze consumer movement, on your own terms. Read more about our product PlaceIQ Movement.


Build the Context You Need Around Your Data
Chances are, we’ve all heard the story of the lighthouse and the naval vessel, in which the captain of a large ship sees a light in the distance and transmits a command that the smaller vessel...

New Year’s Resolutions and Gym Deals: A Catalyst for Changing Consumer Behavior
Consumers kick-started the year by building more health-focused habits, with nearly a 5% increase in visits to gyms and grocery stores, while interest in less healthy options like convenience stores...

B2B Data Enrichment for Beginners
Your competitors use data to target your customers, discover unmet needs, and explore new markets. If you’re not using data to your advantage, you risk falling behind the rest of the pack. In a...